Twin birth rates vary substantially between countries and regions. This page compares twin birth rates by country using national twinning rates measured as twin deliveries per 1,000 total deliveries wherever a comparable Human Multiple Births Database (HMBD) series is available.
The year shown beside each country is the year of the underlying observation, not the year this page was updated. That distinction matters because the latest available data range from 1996 to 2023 across the current country series.
Use the country table below to compare global twin birth rates and see how reported twinning rates differ across countries and regions, while keeping differences in data year and reporting methods in mind.
Twin Birth Rates by Country
The table below shows the latest available observation for each country or territory in the HMBD release used for this comparison. The measurement is kept consistent: twin deliveries per 1,000 total deliveries. This provides a country-by-country view of twin rates while preserving the original observation year and reporting basis for each national series.
Countries are listed alphabetically rather than from highest to lowest because the observation years and treatment of stillbirths are not identical. A numerical difference between two rows should therefore not automatically be interpreted as a precise ranking.
| Country / Territory | Region | Latest Year | Twin Deliveries per 1,000 | Stillbirth Coverage | National Source |
|---|---|---|---|---|---|
| Australia | Oceania | 2020 | 14.29 | Mixed | ABS |
| Austria | Europe | 2021 | 14.49 | Included | Statistics Austria |
| Canada | North America | 2023 | 16.11 | Included | Statistics Canada |
| Chile | South America | 2021 | 11.26 | Excluded | INE |
| Czech Republic | Europe | 2020 | 13.37 | Included | CZSO |
| Denmark | Europe | 2022 | 13.82 | Included | Statistics Denmark |
| Finland | Europe | 2019 | 12.67 | Included | Statistics Finland |
| France | Europe | 2023 | 15.47 | Included | INSEE |
| Germany | Europe | 2020 | 17.93 | Included | Destatis |
| Greece | Europe | 2022 | 28.68 | Included | ELSTAT |
| Iceland | Europe | 2020 | 11.86 | Included | Statistics Iceland |
| Italy | Europe | 1996 | 11.16 | Included | ISTAT |
| Japan | Asia | 2019 | 10.21 | Included | Japan national vital statistics |
| Lithuania | Europe | 2020 | 17.31 | Included | Statistics Lithuania |
| Netherlands | Europe | 2020 | 15.13 | Included | CBS |
| New Zealand | Oceania | 2021 | 13.14 | Included | Stats NZ |
| Norway | Europe | 2020 | 13.28 | Included | SSB |
| Republic of Korea | Asia | 2020 | 24.35 | Excluded | KOSIS |
| Spain | Europe | 2021 | 16.38 | Included | INE |
| Sweden | Europe | 2020 | 13.64 | Included | SCB |
| Switzerland | Europe | 2020 | 15.64 | Included | OFS |
| UK — England and Wales | Europe | 2020 | 14.18 | Included | ONS |
| UK — Scotland | Europe | 2020 | 14.50 | Included | NRS |
| United States | North America | 2021 | 15.83 | Mixed | NVSR |
| Uruguay | South America | 2020 | 12.80 | Mixed | MSP / INE |
How to Read the Twin Birth Rate Data
What Is a Twinning Rate?
In the HMBD definition used for the main country comparison, the twinning rate is the number of twin deliveries divided by the total number of deliveries. The result is commonly expressed as twin deliveries per 1,000 total deliveries.
For example, a rate of 15 per 1,000 means that about 15 out of every 1,000 deliveries in that population were deliveries of twins.
This delivery-level definition is useful for international demographic comparison because one twin pregnancy is counted as one twin delivery rather than two individual babies.
Twin Deliveries vs Twin Babies
Statistics that sound similar can measure different things. They should not be placed in the same ranking unless their definitions have been reconciled.
| Measurement | Numerator | Denominator | How to Interpret It |
|---|---|---|---|
| Twinning rate | Twin deliveries | All deliveries | One twin pregnancy is counted as one twin delivery. |
| Twin birth rate | Individual babies born as twins | All babies born | Each baby in a twin pair is counted separately. |
| Multiple maternity rate | Maternities producing multiple babies | All maternities | May include twins and higher-order multiple births. |
The numerical difference can be large. The US National Center for Health Statistics reported 30.1 twin babies per 1,000 total births in 2024. That figure is not the same metric as the HMBD US delivery-level rate in the main table.
England and Wales provides another example. The Office for National Statistics reported a multiple maternity rate of 13.8 per 1,000 maternities in 2024. That measure includes multiple maternities rather than only HMBD-defined twin deliveries.
Why the Data Year Matters
International datasets do not receive new observations for every country at the same time. A country with a 2023 observation and one with a 2020 observation are not being measured at exactly the same point in time.
This matters because twinning rates can change over relatively short periods as maternal age patterns, use of fertility treatment, embryo-transfer practice, fertility patterns, registration rules and data revisions change.
For this reason, every country value on this page keeps its observation year visible. The publication or review date of this page should never be interpreted as the year of every underlying statistic.
Countries With the Highest Twin Birth Rates
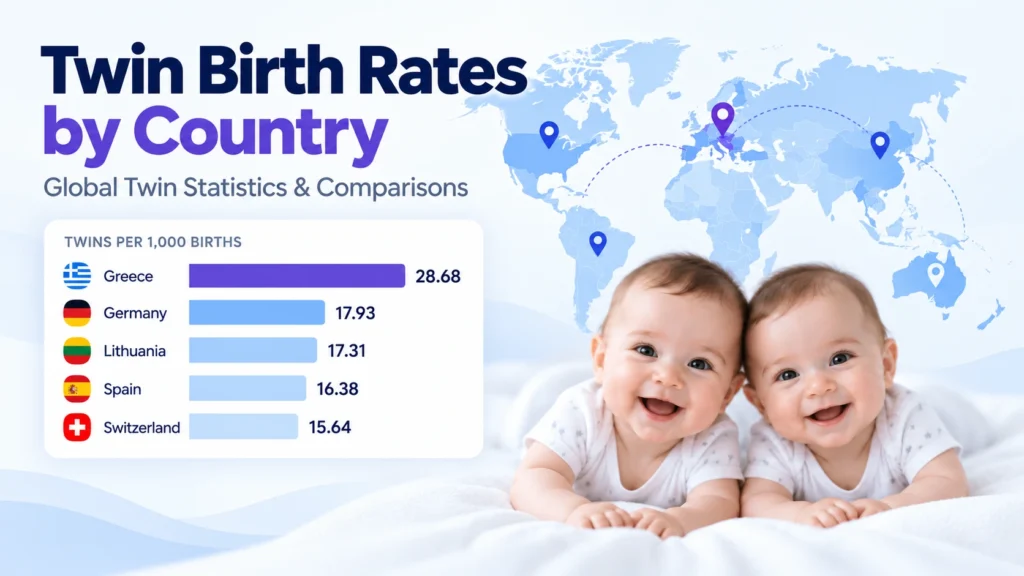
Within the comparable subset used on this page — twin deliveries per 1,000 total deliveries, observed between 2020 and 2022, from national series that include stillbirths — Greece has the highest twin-delivery rate, at 28.68 per 1,000 deliveries in 2022.
That is not the same as the country with the most twins in the world. Several countries outside the civil-registration table have higher estimated rates, and they are covered separately below. A simple highest-to-lowest ranking of every latest observation would also be misleading, because observation years and stillbirth definitions differ between countries. The table below therefore applies three conditions:
- The metric is twin deliveries per 1,000 total deliveries.
- The latest observation falls between 2020 and 2022.
- The country’s selected series includes stillbirths.
Fifteen of the twenty-five series in the main table meet all three conditions.
Highest Latest Comparable Rates
| Rank Within Subset | Country | Year | Twin Deliveries per 1,000 |
|---|---|---|---|
| 1 | Greece | 2022 | 28.68 |
| 2 | Germany | 2020 | 17.93 |
| 3 | Lithuania | 2020 | 17.31 |
| 4 | Spain | 2021 | 16.38 |
| 5 | Switzerland | 2020 | 15.64 |
This is deliberately not presented as a worldwide ranking. Canada and France have newer 2023 observations and are excluded by the time-window rule. The Republic of Korea records a high 2020 value of 24.35, but its series excludes stillbirths, so it falls outside this like-for-like subset.
Highest Twin Birth Rates in Europe
Europe is the best-covered region in the HMBD release used here, so a European comparison is more complete than a worldwide one. Fourteen European series meet the restricted rule, and they are ranked below on the same basis.
| Rank | Country / Territory | Year | Twin Deliveries per 1,000 |
|---|---|---|---|
| 1 | Greece | 2022 | 28.68 |
| 2 | Germany | 2020 | 17.93 |
| 3 | Lithuania | 2020 | 17.31 |
| 4 | Spain | 2021 | 16.38 |
| 5 | Switzerland | 2020 | 15.64 |
| 6 | Netherlands | 2020 | 15.13 |
| 7 | UK — Scotland | 2020 | 14.50 |
| 8 | Austria | 2021 | 14.49 |
| 9 | UK — England and Wales | 2020 | 14.18 |
| 10 | Denmark | 2022 | 13.82 |
| 11 | Sweden | 2020 | 13.64 |
| 12 | Czech Republic | 2020 | 13.37 |
| 13 | Norway | 2020 | 13.28 |
| 14 | Iceland | 2020 | 11.86 |
Three European series are excluded by the time-window rule rather than by their rate: France (15.47 in 2023), Finland (12.67 in 2019) and Italy (11.16 in 1996). France’s newer observation would place it between Switzerland and the Netherlands if mixed observation years were permitted, which is precisely why the restricted rule exists.
Greece therefore has the highest reported twin-delivery rate in this European comparison, but the figure describes one national series in one year rather than a permanent European ranking.
Highest Twinning Rates Outside Civil-Registration Data
The HMBD table above covers countries whose births are comprehensively registered by multiplicity. It does not include the countries with the highest twinning rates measured anywhere in the world, because those rates are derived from representative household surveys and modelled estimates rather than complete vital registration.
Two widely cited answers circulate for the question of which country has the most twins, and they come from different studies using different data and different periods.
- Benin, at about 27.9 twin deliveries per 1,000.
From a study of Demographic and Health Survey data covering roughly 2.5 million births across 75 to 76 low- and middle-income countries, collected between 1987 and 2010. - Ivory Coast, at about 24.9 twin deliveries per 1,000 for 2010–2015, followed by Ghana and South Sudan at about 24.8.
From the later 165-country global comparison, which uses a defined 2010–2015 reference window.
Both figures can be correct within their own study design. They differ because the reference periods, country coverage and estimation methods differ, which is the same comparability problem that governs the registration-based tables on this page.
The wider regional pattern is more stable than any single national figure. A zone of high twinning rates above 18 per 1,000 has been documented running from Guinea along the Atlantic coast to the Democratic Republic of the Congo, and then east towards Tanzania, Mozambique and the Comoros. Rates are clearly lower to the south, at around 11 to 15 in Namibia, Lesotho, South Africa and Madagascar, and decrease gradually to the north, with Egypt at about 17.7 a notable exception. Twinning is substantially lower across much of Asia and Latin America, often below 8 per 1,000.
This research also revised an older assumption. Nigeria was long described as having the highest twinning rate in the world, but the survey evidence indicates that high twinning is the dominant pattern across the whole Central African region rather than a Nigerian peculiarity, and several countries record higher national rates than Nigeria.
A note on community-level claims: figures of roughly 45 to 50 twin sets per 1,000 live births are frequently quoted for the Yoruba population and for the town of Igbo-Ora in Nigeria. These are community or ethnic-group estimates rather than national statistics, and the most widely repeated town-level figures are not drawn from a national registration system. They should not be placed in the same table as the national rates above.
Historically High Natural Twinning Rates
Modern country rates do not tell the same story as natural or largely pre-treatment twinning patterns. Before medically assisted reproduction became widespread, the strongest geographic differences were largely associated with natural dizygotic twinning.
A major international comparison found that Africa had the highest regional twinning rate in 1980–1985, at about 16.5 twin deliveries per 1,000 deliveries. At that time, rates were substantially lower in Europe, North America, Asia and South America.
Countries With the Lowest Twin Birth Rates
The same restricted comparison rule used for the highest-rate table identifies the lower end of the comparable 2020–2022 subset. These values should still be interpreted as national observations rather than permanent biological characteristics of each population.
| Rank Within Subset | Country / Territory | Year | Twin Deliveries per 1,000 |
|---|---|---|---|
| 1 | Iceland | 2020 | 11.86 |
| 2 | New Zealand | 2021 | 13.14 |
| 3 | Norway | 2020 | 13.28 |
| 4 | Czech Republic | 2020 | 13.37 |
| 5 | Sweden | 2020 | 13.64 |
These are the lowest values only within the defined comparison subset. They should not be interpreted as the five lowest twin birth rates in the entire world. Iceland’s series is also based on a small annual number of deliveries, so year-to-year movement in its rate can be larger than in more populous countries.
Global research using survey and estimated data has found substantially lower twinning across much of East, South-East and South Asia and in parts of South America, often below 8 per 1,000. The current HMBD civil-registry table does not contain enough countries to construct a credible modern worldwide lowest-country ranking.
Twin Birth Rates by Region
Regional comparisons help explain why a modern country table cannot be understood purely as a ranking. Natural twinning patterns differed substantially before fertility treatment became widespread, and assisted reproduction has since altered the geographic pattern.
| Region | 1980–1985 | 2010–2015 | Broad Pattern |
|---|---|---|---|
| Africa | 16.5 | 17.1 | Historically high rates with relatively limited overall change in the study period. |
| Asia | 7.0 | 9.2 | Historically low overall, followed by substantial increases in several countries. |
| Europe | 9.1 | 14.4 | Large increase associated with changing maternal age and medically assisted reproduction. |
| North America | 9.9 | 16.9 | One of the largest regional increases over the comparison period. |
| Oceania | 10.1 | 14.8 | Substantial increase over time. |
| South America | 8.7 | 9.3 | Relatively small overall change in the study comparison. |
| World | 9.1 | 12.0 | Global twinning rose by roughly one third. |
The figures are twin deliveries per 1,000 total deliveries and refer to the two multinational study periods, not to the current year.
Expressed as a share, the 2010–2015 global rate of 12.0 per 1,000 means that roughly 1.2% of deliveries worldwide were twin deliveries, or about one in 83 deliveries. Counted at the level of individual babies rather than deliveries, the same study describes about one in every 42 children born worldwide as a twin, with around 1.6 million twin pairs born each year. The two figures are not in conflict: they use the different units set out earlier on this page.
Africa remained the highest-rate region in the 2010–2015 comparison, but the gap narrowed substantially as rates increased in Europe, North America, Oceania and parts of Asia. Asia and Africa together accounted for around 80% of the world’s twin deliveries in that period. The broad continental averages also hide major differences between countries within the same region.
Why Twin Birth Rates Differ Between Countries
Differences between national twin rates do not have a single cause. They can reflect biological and demographic differences, fertility treatment, and differences in how births are registered and measured.
Natural and Biological Differences
Most of the geographic variation in twinning is associated with dizygotic twins, commonly called fraternal twins. Dizygotic twins arise when two separate eggs are fertilized in the same pregnancy.
Monozygotic twins, commonly called identical twins, arise when a single fertilized egg divides. Their rate is much more stable across populations. A major global review describes monozygotic twinning as occurring at roughly four per 1,000 deliveries across populations, meaning most international variation in total twinning reflects differences in dizygotic twinning.
These natural patterns help explain why some regions had substantially different rates even before modern fertility treatment became widely available.
Maternal Age and Population Structure
Maternal age also affects population-level twinning rates. Older maternal age is associated with a higher probability of dizygotic twinning, so countries in which births increasingly occur at older maternal ages can experience an increase in the national twin-delivery rate.
Birth order and broader fertility patterns can also contribute. These demographic effects should be interpreted at population level: they help explain national trends, but they do not mean every individual within a country has the country’s average probability.
Fertility Treatment and Assisted Reproduction
Medically assisted reproduction (MAR) has been one of the most important drivers of the modern rise in twinning in many countries.
MAR is a broad term. Assisted reproductive technology (ART) is a subset that includes treatments such as in vitro fertilization (IVF), where eggs and sperm are handled outside the body before embryos are transferred. MAR can also include treatments such as ovarian stimulation and artificial insemination.
Historically, transferring more than one embryo during IVF and other fertility-treatment practices increased the probability of multiple pregnancy. Because access to and use of these treatments developed at different times in different countries, their effect on national twin rates has also varied geographically.
More recently, greater use of single-embryo transfer has helped reduce treatment-related twinning in some countries.
Registration and Statistical Differences
Not every apparent country difference is biological or medical. Statistical definitions also matter.
- Some datasets count deliveries, while others count individual babies.
- Some national series include stillbirths and others exclude them.
- Definitions can change over time within the same country.
- National registration completeness can vary.
- Older observations may be revised when statistical agencies update historical series.
These issues are why this page keeps the measurement definition, year and stillbirth coverage visible rather than reducing every country to a single context-free number.
How Twin Birth Rates Have Changed Over Time
The Global Rise in Twinning
The international pattern of twin births changed markedly from the 1980s into the early twenty-first century.
A study collected or estimated twinning rates for 165 countries covering more than 99% of the world’s population for the 2010–2015 period, and for 112 of those countries it was also able to obtain rates for 1980–1985. Across that comparison the worldwide twinning rate increased from 9.1 twin deliveries per 1,000 deliveries to 12.0, an increase of roughly one third.
The largest regional increases occurred outside Africa. Europe rose from 9.1 to 14.4 per 1,000, North America from 9.9 to 16.9, Oceania from 10.1 to 14.8, and Asia from 7.0 to 9.2. Africa remained high, moving from 16.5 to 17.1.
Across the 112 countries that could be compared between the two periods, 74 recorded an increase of more than 10%, while only seven recorded a decrease of more than 10%. The combination of later childbearing and expanding use of medically assisted reproduction played an important role in many higher-income countries.
Why Rates Have Stabilized or Declined in Some Countries
A rising long-term trend does not mean that twin rates must keep increasing indefinitely. Some national series have stabilized or declined.
One reason is a change in fertility-treatment practice. As clinics increasingly aim to achieve singleton pregnancies and use single-embryo transfer more often, the contribution of treatment to twin pregnancies can fall.
The recent United States trend illustrates this change. The US twin-birth measure, which counts twin babies rather than twin deliveries, fell from 33.9 per 1,000 births in 2014 to 30.1 in 2024.
Denmark, Norway, Sweden, the Netherlands and several other HMBD countries also show lower recent delivery-level rates than around 2000. A changing trend should not be attributed to one cause without country-specific evidence, because maternal age, treatment policy and statistical changes can occur at the same time.
Data Sources, Methodology and Comparability
International twin statistics are only useful when the source and measurement rules are transparent. The approach used on this page prioritizes comparability over producing the largest possible list of countries.
Source Hierarchy
- National civil-registration and vital-statistics systems:
preferred where births by multiplicity are comprehensively registered. - Human Multiple Births Database:
used to harmonize and document national twin-delivery series and their metadata. - Representative national surveys:
useful for broader global research when reliable civil-registration data are unavailable. - Peer-reviewed estimates:
useful for filling well-defined evidence gaps when the source and estimation method are explicit.
The main 25-series country table on this page is based on HMBD national series rather than attempting to mix them with modelled estimates from countries without comparable annual registration data. Where survey-based estimates are discussed, as in the section on rates outside civil registration, they are labelled as such and kept out of the ranking tables.
Observed vs Estimated Rates
An observed national rate is derived from registered deliveries or equivalent national statistics. An estimated rate is inferred using survey data, published studies or other demographic information when complete national vital statistics are not available.
Both can be useful, but they answer slightly different evidentiary questions. The broader 165-country global research used a combination of collected and estimated rates to create worldwide regional comparisons. The main country table here is intentionally narrower.
Live Births and Stillbirths
Stillbirth treatment is one of the most important comparability issues in international multiple-birth statistics.
Consider a twin delivery in which one baby is live-born and the other is stillborn. Depending on the statistical system, that event may be classified as a twin delivery or treated differently when only live births are counted. A delivery in which both babies are stillborn may also be included or excluded depending on national definitions.
The HMBD therefore documents stillbirth treatment in country metadata where it can be established. The main table preserves a simplified coverage label of Included, Excluded or Mixed so users can see this issue before comparing rates.
Rules for Country Rankings
This page does not rank every country’s latest value together. The highest, European and lowest comparison tables apply a narrower first-party rule:
- Use the HMBD twin-delivery definition.
- Include only observations from 2020 through 2022.
- Include only series classified as including stillbirths.
- Use the latest eligible observation for each country or territory.
- Label the result as a restricted comparison subset rather than a worldwide ranking.
Fifteen of the twenty-five series in the main table satisfy all three of the first conditions. The ten excluded series are Canada and France (2023 observations), Finland and Japan (2019), Italy (1996), Chile and the Republic of Korea (stillbirths excluded), and Australia, the United States and Uruguay (mixed stillbirth coverage).
This does not make every remaining national definition perfectly identical, but it removes two major sources of avoidable distortion: widely separated reference years and different stillbirth-coverage categories.
Update Policy
Country observations should be reviewed when the HMBD publishes a new release or when national statistical agencies publish materially newer multiple-birth data.
Any update should preserve the original observation year and measurement definition. Newer national statistics should not silently replace an older HMBD figure if the newer statistic uses a different denominator.
Changes to definitions, source selection or ranking methodology should be documented alongside data revisions rather than treated as ordinary editorial updates.
Limitations of International Twin Birth Statistics
International twinning data are informative, but they should not be interpreted as perfectly synchronized measurements of every population.
- Limited geographic coverage:
the current annual HMBD table covers countries with sufficiently reliable underlying series, not every country in the world. - Old observations:
some national series have not been updated recently. Italy is the clearest example in the table used here. - Small-population volatility:
countries with few annual deliveries, such as Iceland, can show larger year-to-year movement for reasons unrelated to any underlying change. - National averages hide local variation:
twinning rates can vary within countries as well as between them. - Treatment prevalence changes:
IVF, other medically assisted reproduction and embryo-transfer policies can change over time. - Population structure changes:
maternal age and birth-order distributions are not fixed. - Observed and estimated data are not identical evidence:
broad global studies sometimes require survey-based or modelled estimates for countries without complete registration.
For these reasons, small numerical differences between countries should not automatically be interpreted as meaningful biological differences.
Country Twin Rates vs Your Personal Chance of Twins
A national twinning rate describes a population. It is not an individual’s personal probability of having twins.
Individual twin probability can depend on factors that are not represented by the country’s average, including maternal age, fertility treatment, pregnancy history and factors associated specifically with dizygotic twinning.
Country statistics are therefore best used as population context. For an individualized educational estimate, use the Odds of Twins Calculator and its documented methodology rather than treating the national rate as a personal forecast.
Frequently Asked Questions
Which country has the highest twin birth rate?
There is no single universally valid answer, because national datasets use different years and sometimes different definitions. Within the restricted comparable subset of registration-based series used on this page, Greece has the highest twin-delivery rate at 28.68 per 1,000 deliveries in 2022. Looking beyond civil-registration data, survey-based research has recorded higher national rates in Central and West Africa, with Benin at about 27.9 per 1,000 and Ivory Coast at about 24.9 for 2010–2015.
Which country has the most twins in Europe?
Greece, at 28.68 twin deliveries per 1,000 deliveries in 2022, within this page’s restricted European subset of fourteen series. Because France’s newer 2023 observation and Italy’s 1996 observation fall outside the common time window, this should not be read as a permanent ranking of every European country. The full European comparison is in the section on the highest twin birth rates in Europe above.
What percentage of births are twins worldwide?
At the 2010–2015 global rate of 12.0 twin deliveries per 1,000 deliveries, roughly 1.2% of deliveries worldwide were twin deliveries, or about one in 83. Counting individual babies instead of deliveries, about one in every 42 children born worldwide is a twin.
Why do two sources sometimes show different twin birth rates for the same country?
They may be counting different units, using different years or applying different stillbirth rules. One source may report twin deliveries per 1,000 deliveries while another reports individual twin babies per 1,000 total births. Both values can be correct within their own definitions without being directly comparable.
Are identical twins equally common around the world?
Monozygotic, or identical, twinning varies much less geographically than dizygotic, or fraternal, twinning. Global research commonly places monozygotic twinning at roughly four twin deliveries per 1,000 deliveries across populations. Most of the large international differences in total twinning therefore reflect dizygotic twins.
Can twin rates from different years be compared?
They can be compared descriptively, but caution is needed. A 2023 rate and a 2019 rate are not simultaneous observations, and twin rates can change as maternal age patterns, fertility treatment and registration practices change. For formal ranking, a narrower common time window is preferable.
Do twin birth statistics include stillbirths?
Sometimes. The treatment of stillbirths varies by national statistical system and can also change over time. This is why the main country table shows the HMBD stillbirth coverage classification where available.
Does my country’s twin rate tell me my personal chance of having twins?
No. It gives population context, not an individualized probability. Personal odds can differ from the national average because they depend on individual reproductive and demographic factors.
Why do twin birth rates vary by country?
Twin birth rates can differ because of maternal age patterns, fertility treatment use, natural dizygotic twinning rates, population structure, and differences in national birth-registration methods.
Sources and Data Notes
The country-level table is based on the Human Multiple Births Database, distributed by the French Institute for Demographic Studies (INED), using the HMBD 2025-05-26 release and the national statistical series represented within that release.
- Human Multiple Births Database (HMBD), INED.
Primary source for the country-level twin-delivery series and country metadata. - Torres, Caporali and Pison. The Human Multiple Births Database.
Demographic Research, 2023, 48(4), 89–106.
Methodological description of the database. - Monden, Pison and Smits. Twin Peaks: more twinning in humans than ever before.
Human Reproduction, 2021, 36(6), 1666–1673.
Source for the global and regional 1980–1985 versus 2010–2015 comparison, the 2010–2015 national estimates for Ivory Coast, Ghana and South Sudan, and the discussion of medically assisted reproduction, maternal age and geographic variation. - Smits and Monden. Twinning across the Developing World.
PLOS ONE, 2011, 6(9), e25239.
Source for the Benin national estimate, the Central African high-twinning zone, and the regional survey-based comparisons outside civil-registration systems. - Our World in Data. Share of births that are twins.
HMBD-based historical visualization and documentation of cross-country processing and stillbirth-comparability issues. - Martin and Osterman. A Decade of Decline in Twin Childbearing in the United States, 2014–2024.
US National Center for Health Statistics, NCHS Health E-Stats No. 117, June 2026.
Used to illustrate the distinct US birth-level measure of twin babies per 1,000 births. - Office for National Statistics. Births in England and Wales: 2024.
Statistical bulletin, accredited official statistics.
Used to illustrate the separate multiple-maternity metric.
Measurement note:
The principal country comparison on this page uses twin deliveries per 1,000 total deliveries. Statistics using twin babies per 1,000 births or multiple maternities per 1,000 maternities are discussed separately and are not silently mixed into the same ranking.